A Call for Collective Action: Water, Waste, and Disease
by Jennifer D. Olsen
The Global Burden
On the outskirts of Bethlehem, in the West Bank, sits Aida refugee camp. Established in 1950, this camp began as an informal settlement for Palestinian families displaced by conflict. Sixty-five years later, the nearly 5,000 refugees living there are surviving on stopgap water and sanitation infrastructure. Water does not flow freely and during the summer months, it often does not flow at all. During the summer, contaminated water is a looming concern for the people here. Water that sits, stagnant, in the pipelines and cisterns has a greater risk of contamination, and consequently, a greater risk of illness for those who drink it.
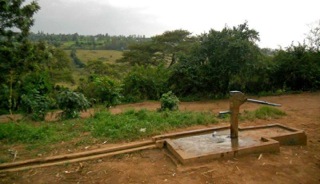
In an otherwise different part of the world, women and children approach a community water pump in the mountainous country of Rwanda. The water pump has broken, and to use it leads to contamination and further disrepair. Families will instead spend hours collecting dirty water from puddles, streams and swamps. In no way dissimilar to other villages in this country, piped water is not a guarantee. No matter how it comes, water is not well regulated, if at all. Waste accumulation, poor resources, and limited governmental capacity all contribute to a suffering water quality, and in turn, a suffering population.
Contaminated water is a real concern for these communities, as diarrheal disease, an outcome of poor water quality, kills an estimated 2,300 people per day globally. According to the World Health Organization, a child dies from a water-related illness every single minute. These statistics, though scary in their sheer magnitude, bring perspective to the global water burden. 750 million people in the world (approximately 1 in 9 people) lack access to safe water. That’s more than two times the entire population of the United States.
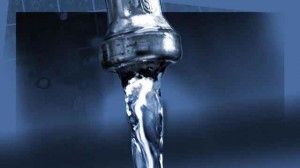
Here in the U.S., we have some of the cleanest water in the world. And yet, most of us don’t drink it. We are the largest consumer of bottled water in the world, and sales have been resolutely rising for over three decades. It makes the rational consumer wonder, why buy water?
The Domestic Paradox
In the U.S., our water is safe and highly regulated. Drinking water is monitored by the Environmental Protection Agency, which sets regulations on safe contaminant levels. The U.S. Public Health Service established fluoridation of the public water supply over fifty years ago and is considered by the CDC as one of the ten greatest public health achievements of the 20th century. Water and waste management systems have also been evolving concurrently to manage the swelling populations of our top cities.
Boston’s own Deer Island is home to the revolutionary Massachusetts Water Resources Authority (MWRA), whose world-renown facilities provide resources to over 2.2 million people in the metropolitan Boston area. The MWRA reports annually on the region’s water, the results of which are distributed to residents and available online for viewing. Monthly reports are also available. The American Water Works Association, a nonprofit dedicated to managing and treating water, recently declared the MWRA’s water to be the second best tasting water in the entire country. You might be thinking, if the MWRA is number two, who has the number one best tasting water? That would be our very own Boston Water and Sewer Commission. Suffice to say, you cannot go wrong with local water.
Look Beyond the Marketing
So now that we know how good our tap water is, why do we buy? The bottled water industry has exploded since the 1990s, and continues to grow as we are inculcated with propaganda that bottled water is cleaner, healthier, and more delicious than the nearly free water from our tap.
However, numerous studies have shown that tap water and bottled water are nearly identical in quality, with half of all bottled water being actually identical, as many large companies get it directly from the public supply. Additionally, bottled water regulations are less strict than tap water regulations and have the potential for more quality discrepancies. Fluoride, for example, is not mandated in bottled water, proposing an increased risk of dental cavities for the dedicated bottled consumer.
Another obvious downside of bottled water is cost. Americans spent $11.8 billion on bottled water in 2012, which is estimated modestly at 300 times or startlingly at 10,000 times, the cost of tap water. Thinking like a snow-sodden New Englander, if the modest consumer switched from plastic to tap for one year, they could save enough money for a two-week trip to tropical Puerto Rico, and in the winter of 2015, that is priceless.
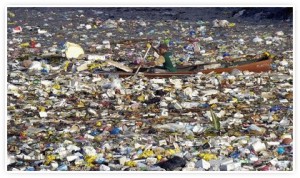
The waste associated with bottled water is dramatic and extends not just to our own environment, but the environments of countries whose water is not nearly as drinkable as ours. Research studying plastic pollution has found that plastic waste finds its way to the ocean, accumulates in ocean currents, and spreads around the world. Plastic water bottles, caps, rings and fragments from the east coast of the US can be reliably tracked into the ocean currents, where they add to the trash accumulation on the shores of far-off countries, or pollute marine life in the vast open seas. A single plastic bottle can have a life span of 1,000 years, adding to the pervasive global burden of waste.
Go Local
One of the biggest arguments for bottled water consumption is convenience. You’re out, you can’t fill up a cup from your sink, so what else are you going to do to stay hydrated? Where can you get a drink without buying into plastic? Well, luckily for Boston, BeCause Water is addressing this problem with the Drop In App. This app, downloadable on your phone, identifies free sources of local water all around the city. Whether you’re out for a run during the hot summer months or, more likely, lost in a frozen snow tundra, this app identifies businesses and shops that are happy to invest in a smaller bottle footprint by offering you free, clean, and delicious water.
So when it comes to drinking water, go local. We have the capacity and the standards to ensure safe, high quality basic needs, a battle that is still waging in much of the world. We should aim to decrease our plastic bottle footprint, and support the local systems that ensure our health and safety each day. By decreasing our consumption of plastic bottles locally, we can help lighten the global burden of water, waste, and disease.